If you are an Owner, Super Administrator, Advanced Administrator, Administrator, or Report Administrator in the SafetySkills LMS, you are able to create, run and view reports to see how your learners are doing with their training. Advanced Administrators, Administrators and Report Administrators can only run reports for the groups they have been given access to; the Owner and Super Administrators can do this for any users in the system.
Before you can create a report, you’ll want to determine the information you need. For example, do you want to see all completed training for a specific location? What about any overdue training for the last quarter for all departments, sorted by supervisor? Or what about a report for all completed training from the last year, including any employees who may have left the company? Once you know what information you need, you’ll be better equipped to navigate the myriad of filtering options available to you.
For this walk-through, we will be running a report for all users who have completed training during the second quarter of this year, but only of the training that was assigned for that quarter.
To begin, please click on the Reports tab. On the left side, under “Filter Options,” are the main filters for running reports.
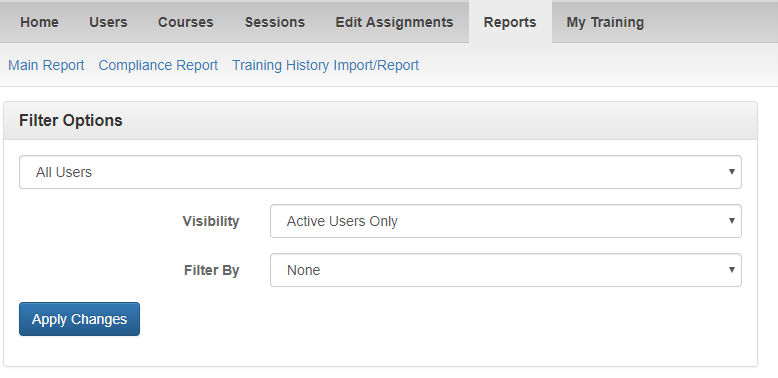
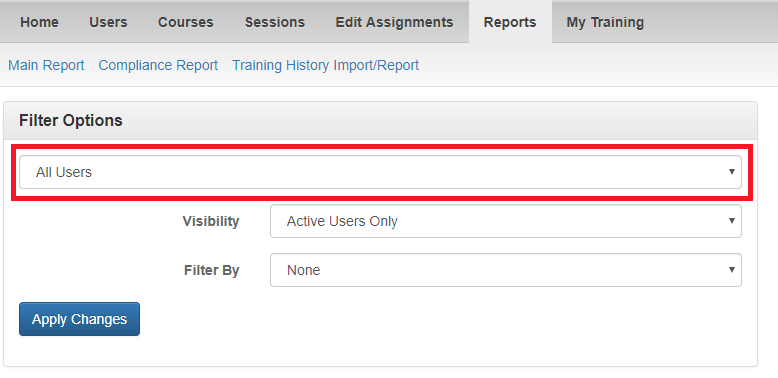
The first filter is where all created groups, if any, will appear.
For our example, however, we will assume I do not have any groups and will leave it at “All Users.”
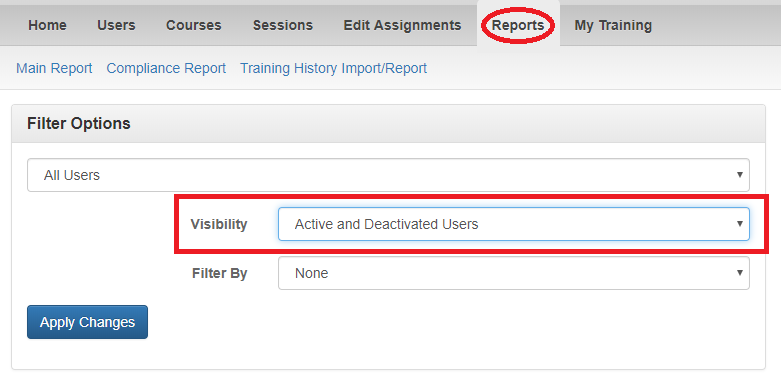
The second filter, Visibility, determines the users who will display in the report based on their status. This filter gives you three options: Active Users Only, Deactivated Users Only, or Active and Deactivated Users.
In our example, I want to see all of the training that was scheduled to be due so far this year, even for employees who may have left the company. In that case, we will select “Active and Deactivated Users.”
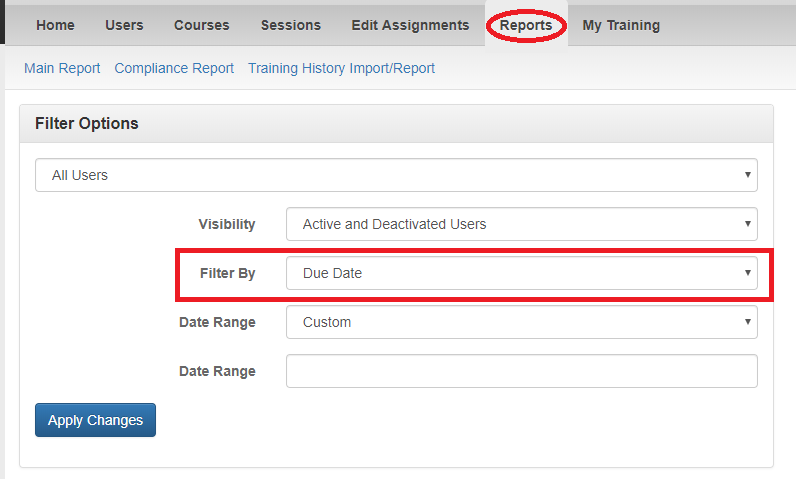
The next drop down is the date you would like to filter your report by. You are given four options:
- Activation Date would pull in courses that were activated, or available to be taken, during the date range
- Assigned Date would pull in courses that were assigned during the date range, but not necessarily available to be taken
- Completed Date would pull in any courses that were completed during the date range, even if they were completed after they were due
- Due Date would pull in courses that were due during the date range you select
For our example, we will select “Due Date,” as we are most interested in courses that were due to be completed during this year. We are not selecting completed date because that would only pull in courses that were completed this year, including any courses that may have been overdue from last year, or ones that activated in October, but aren’t due until January 2020. Selecting “Due Date” allows us to look at only those courses that are due during the date range.
For the final filter, you will select the date range you would like the report to look at. You have multiple choices:
- Custom allows you to select a custom date range
- In the Past will look at any information prior to the day you are running the report
- Previous Month will look at any information in the month prior to the one you are running the report
- Current Month will look at any information in the same month as the one you are running the report
- Next Month will look at any information in the month after the one you are running the report
- In the Future will look at any information after the day you are running the report
For our example, we will be utilizing a Custom date range from January 1, 2019 to October 31, 2019, as we want to see all training occurring so far this year.
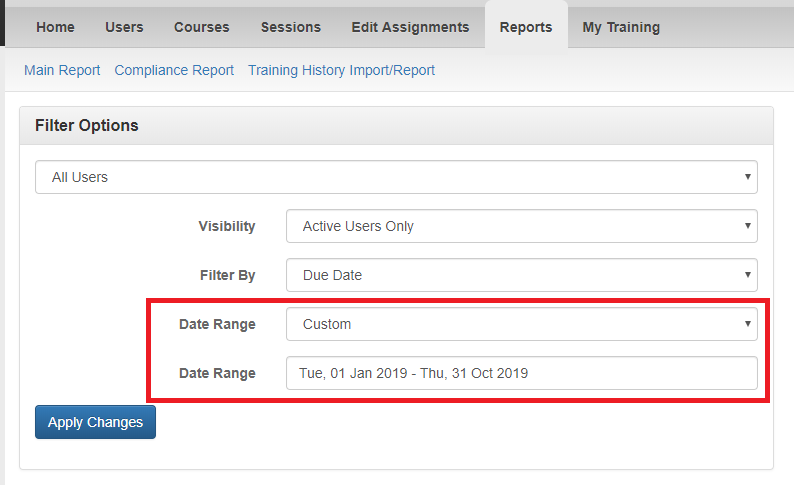
Currently, we have told the system to look at all courses that were due between January 1, 2019 to October 31, 2019 for all active and deactivated users within the account.
Once you have determined your filter settings, click “Apply Changes” to run the report. This will then pull in any information that fits the filters you have selected into the information grid below.
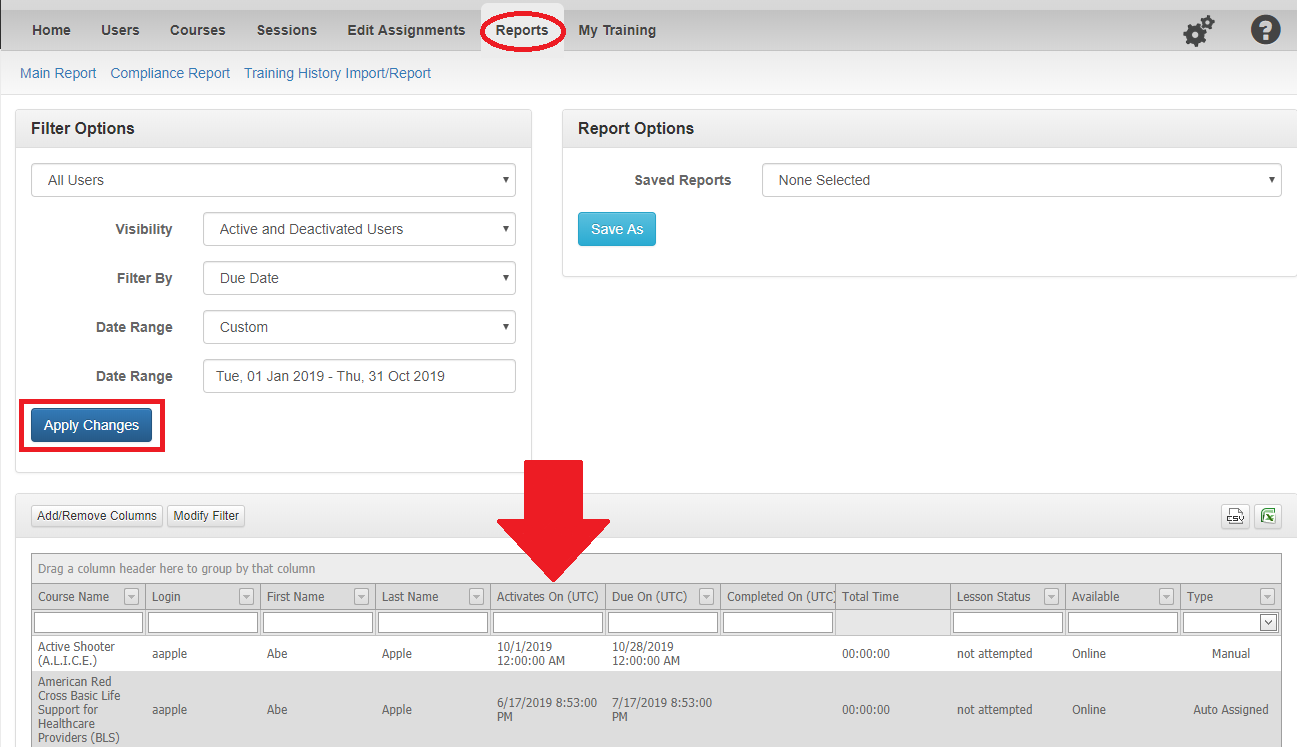
This is going to display a lot of information: it’s all training that was due, not necessarily all that was completed. This means we’ll have some training that is completed, some that is incomplete, and some that has not yet been attempted, for all learners in the system. However, this information is currently not filtered or sorted in any specific order.
There are a few different ways to organize this information. For our example, let’s assume we need to sort by location and supervisor, so that I can distribute my report to the appropriate person in my company. Begin by clicking the “Add/Remove Columns” button in the upper left of the information grid. This is going to open a menu that allows you to remove or add new columns into the grid. These columns include your custom fields, as well as other necessary information, like Assigned Date.
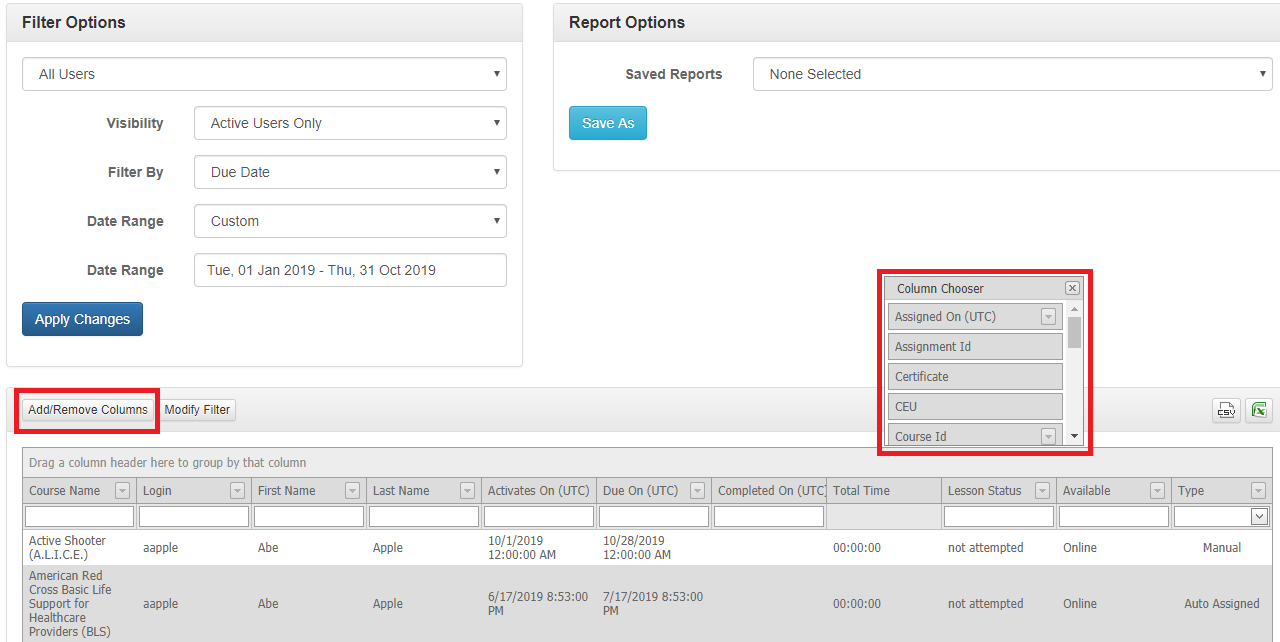
For our example, I am adding “Supervisor” and “Location” into the grid, since I know I want to sort by that information. Additionally, I will drag and drop the “Total Time,” “Available,” and “Type” columns back into the column chooser since I don’t need that information on my report. Now, my information grid looks like this:
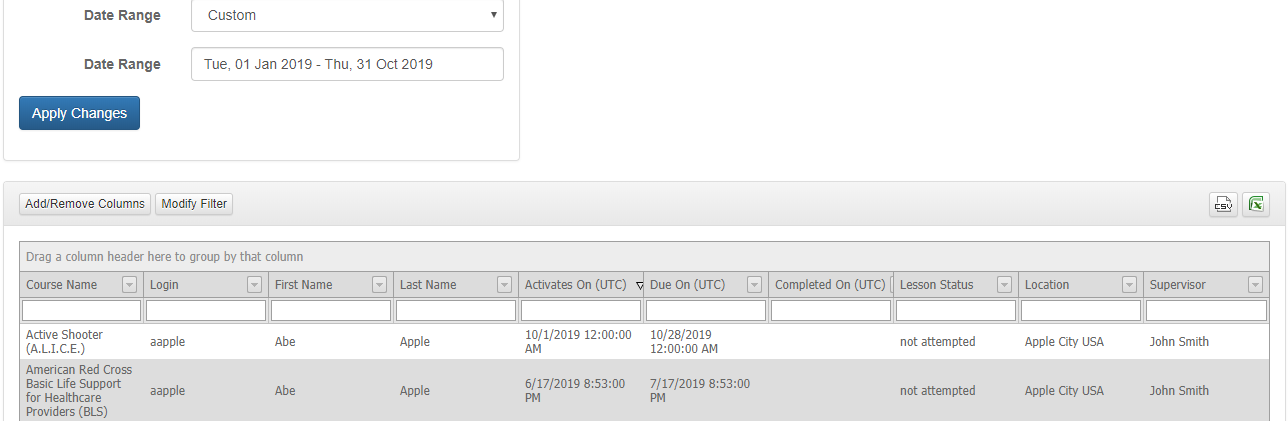
Finally, I know I need to sort all of the course information by location and supervisor. To do that, I will drag and drop first the “Location” column above the current column listing. This will sort all of the report information by location first. Then, I’ll drag the “Supervisor” and “Login” columns up, to have the report sort first by location, then by supervisor, and finally by login.
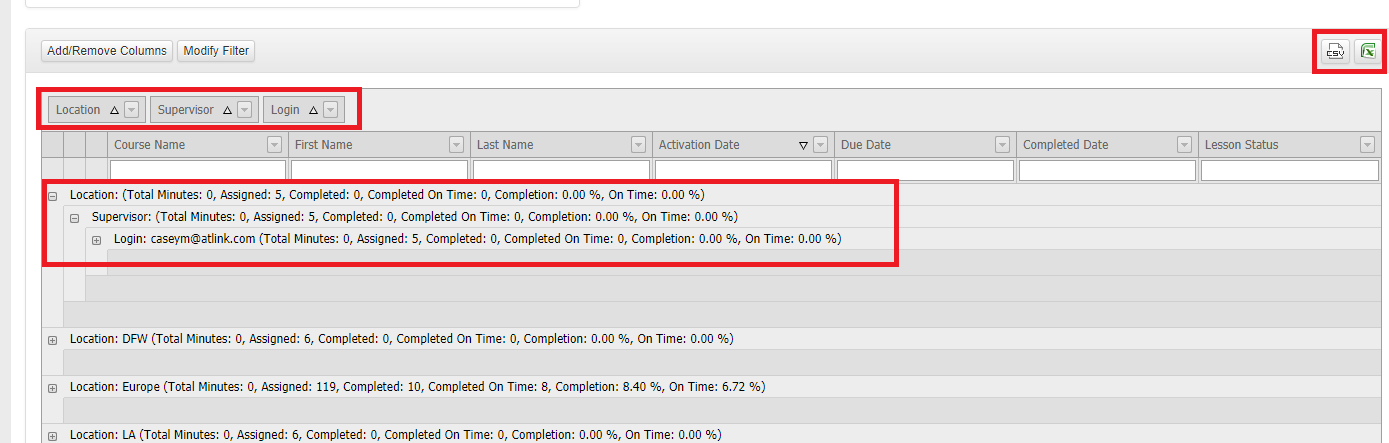
With the report currently sorting by Location, Supervisor, and Login, it will compress the report information. You may click on the “+” button to the left of each row to expand each selection. Each line is also summarized in a line next to the original filter. For example, I can see at a glance that my DFW location has a total of 6 assignments that fall within my criteria, and 0 of those were completed, whereas my Europe location has 119 assignments, 10 of those were completed, and 8 of those completed assignments were completed on time.
Now, I can export my report to Excel by clicking one of the two export options at the upper right of the information grid.
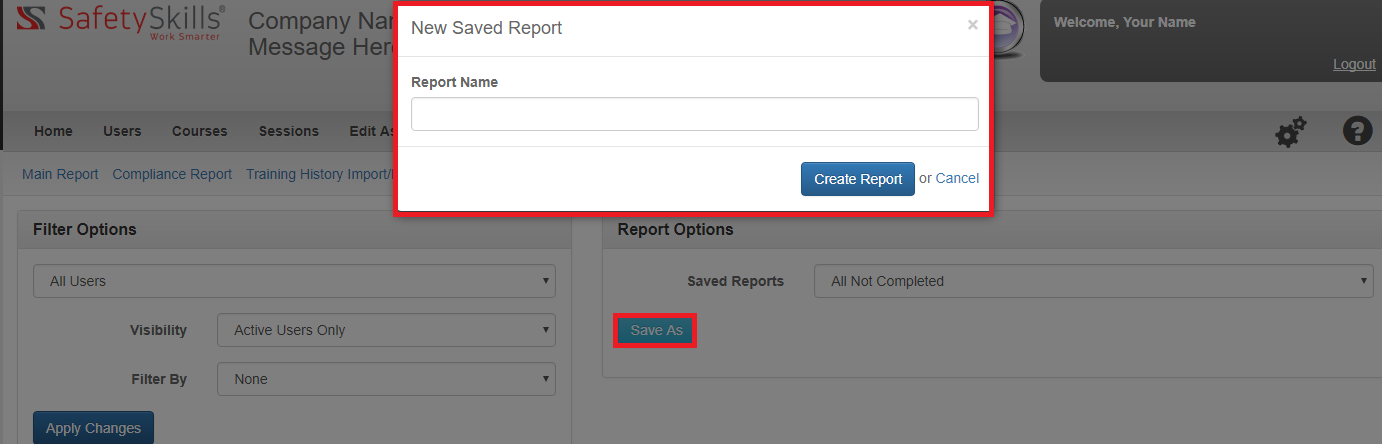
If you’d like to save and access this report again, you can do so by by clicking the blue “Save As” button under Report Actions. This will generate a pop-up prompting you to name your custom report.
After naming your report, you also have some additional customization options.
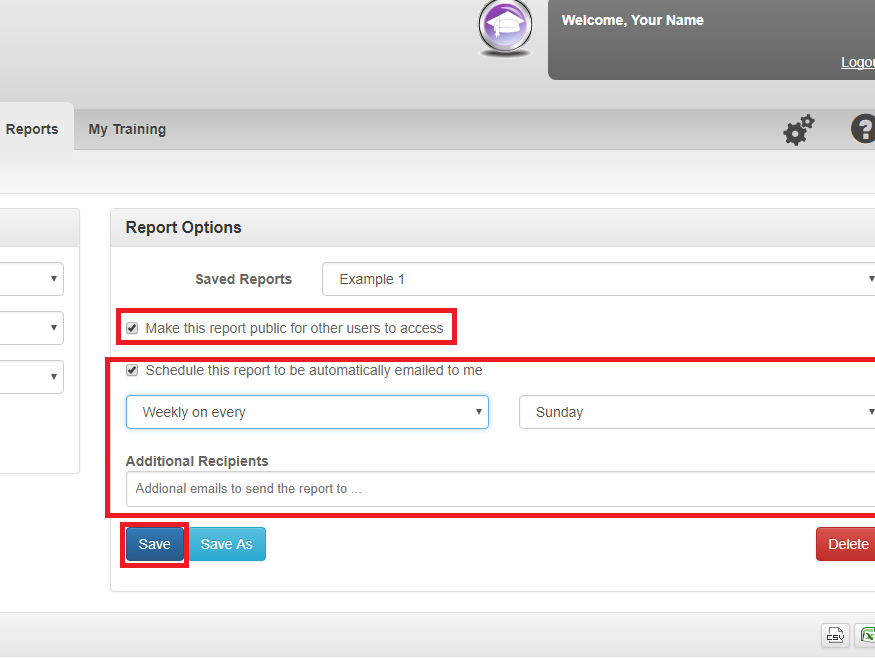
The first option is to make the report public for other users. Checking this box would allow the report to display in the Saved Reports drop-down for other administrators to access.
The second option is to schedule the report to be automatically emailed to you either on the first of every month, the first and fifteen of every month, or weekly on a set day. Checking this box will allow you to select which scheduled option you would prefer. Additionally, you may enter email addresses of other recipients who should have the report emailed to them. These recipients do not have to be a user in the system to receive the report.
When you are finished customizing your settings, be sure to click the blue “Save” button again.