If you are an Owner, Super Administrator or Administrator in the SafetySkills LMS, you are able to create, run and view reports to see how your learners are doing with their training. While Administrators can only run reports for the groups they have been given access to, the Owner and Super Administrators can do this for any users in the system. For more information on creating and saving reports, please click here.
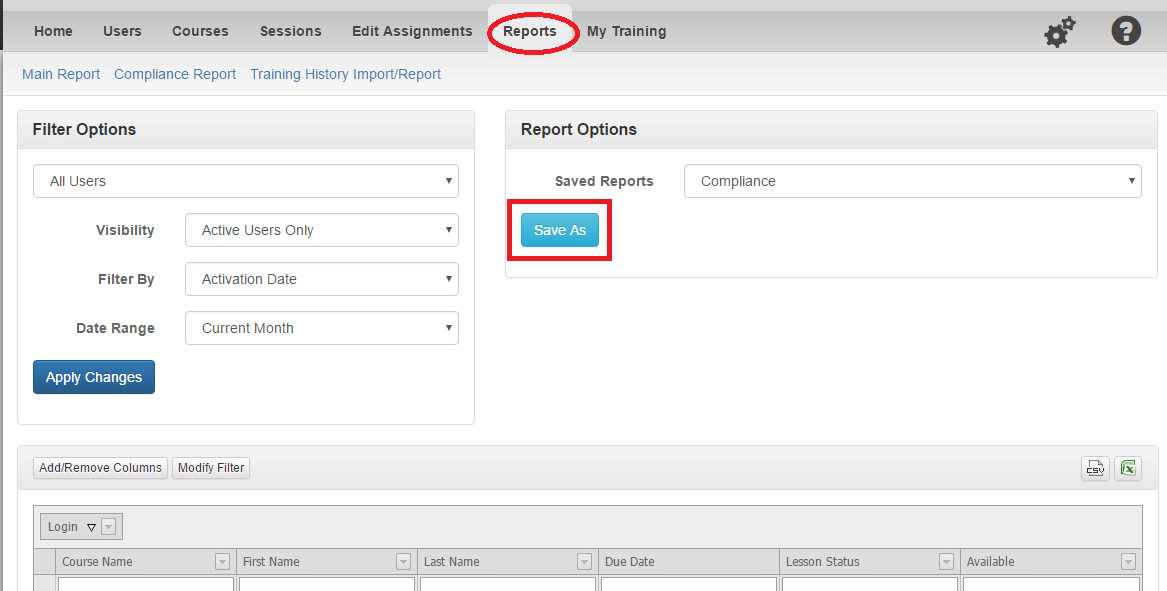
From the Reports tab, you can now run a summarized report that will detail the time spent in training, compliance percentage, and outstanding training. To run this report, use the “Report Options” drop-down on the right, and select “Compliance.”
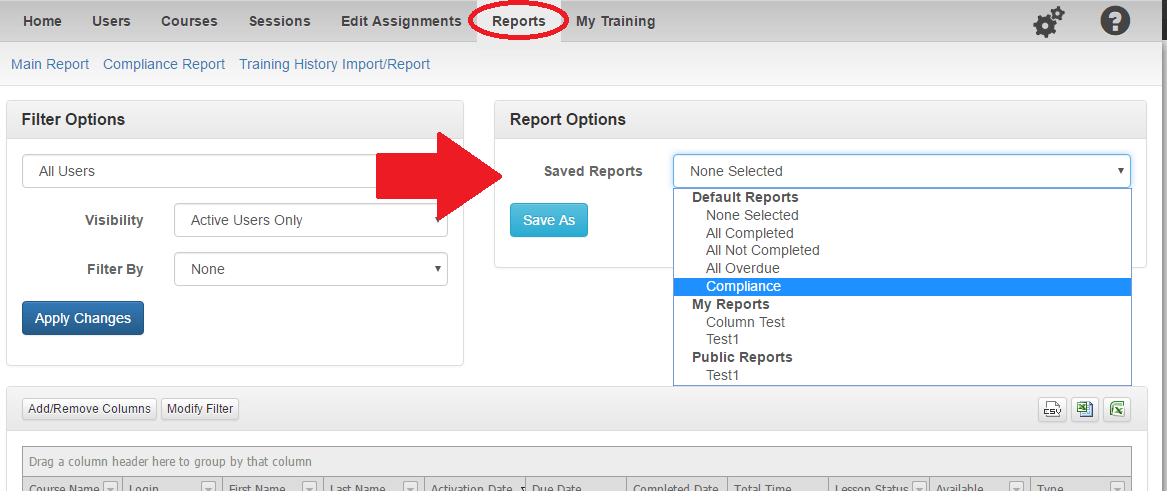
From there, you can use the drop-down options on the left to choose the data you wish to pull into the report.
- The initial drop-down will allow you to choose from groups or all users.
- The “Visibility” drop-down allows you to choose from active users, deactivated users, or both active and deactivated users.
- The “Filter By” drop-down allows you to choose from activation date, due date, assigned date, completed date, or none.
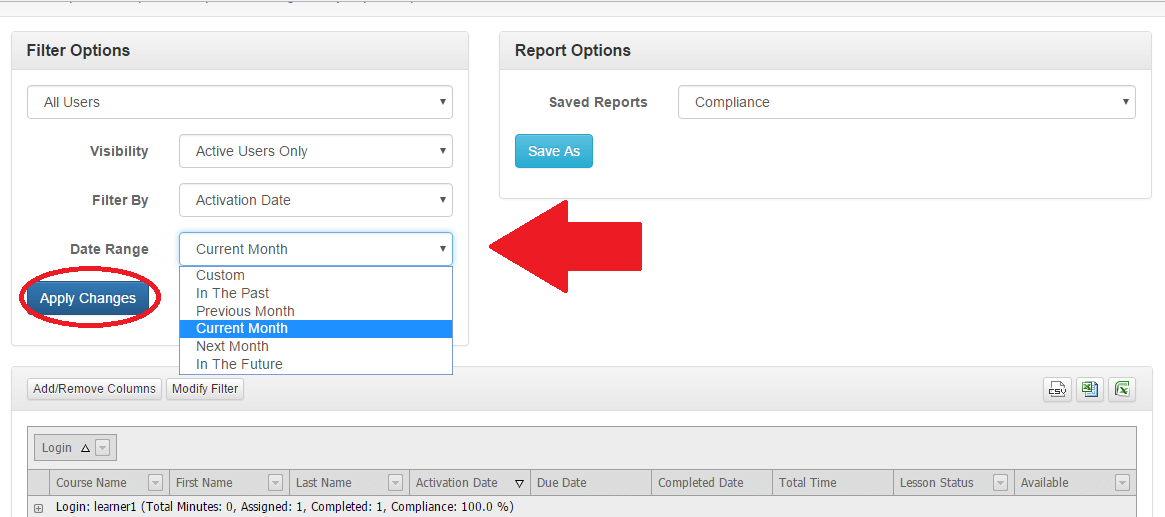
- Depending on the “Filter By” option you chose, you can then select the date range the filter applies to from the “Date Range” drop-down.
For example, if you want to filter by the date a course was activated, you can then choose any activation date that occurred “In the Past,” “Previous Month,” “Current Month,” “Next Month,” “In the Future,” or choose “Custom Range” to select a custom date range. Then, click the blue “Apply Changes” button to have the data populate in the table.
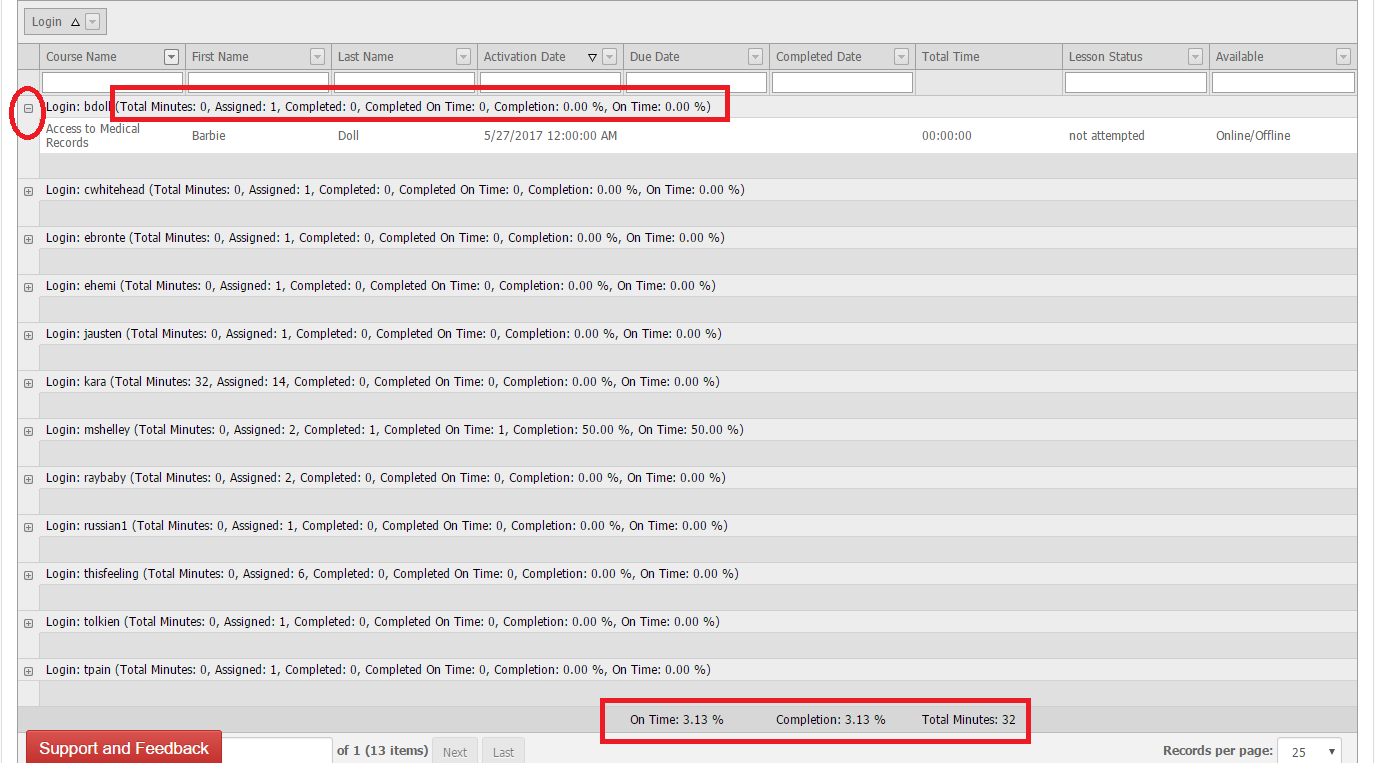
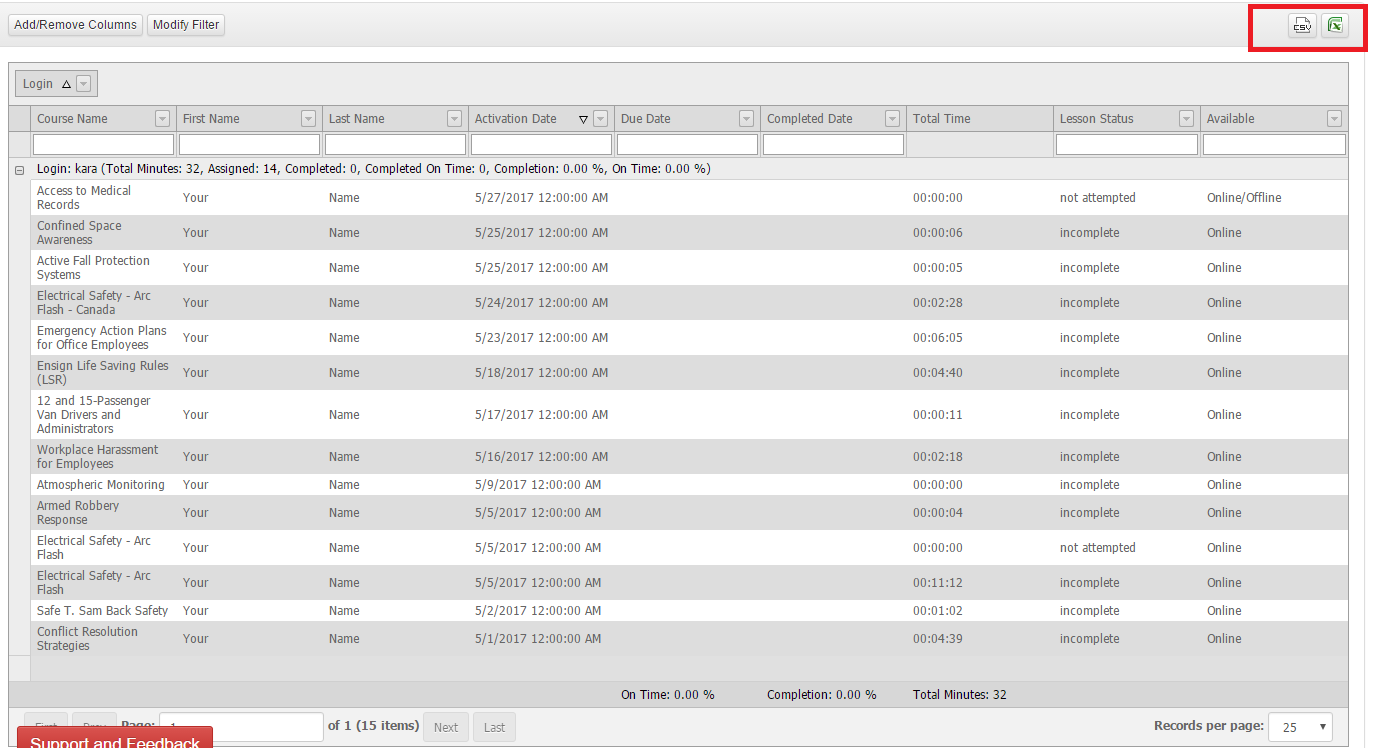
The data in the table will automatically filter by “Login.” This shows you a summary, by login, of the user’s compliance percentage, the total minutes spent on training, and the number of courses they have been assigned and have completed. The total minutes spent on training and the total compliance percentage for the entire data list presented in the table is listed at the bottom.
To see a detailed list of the courses for each learner, click the “+” next to their login.
You can alter the way the table data is sorted by dragging the column headers to and from the text box at the top of the table.
For example, to remove the “Login” filter, you will click and hold your mouse on the “Login” box, and drag it back to the column headers. When you see two white arrows, you can release your mouse.
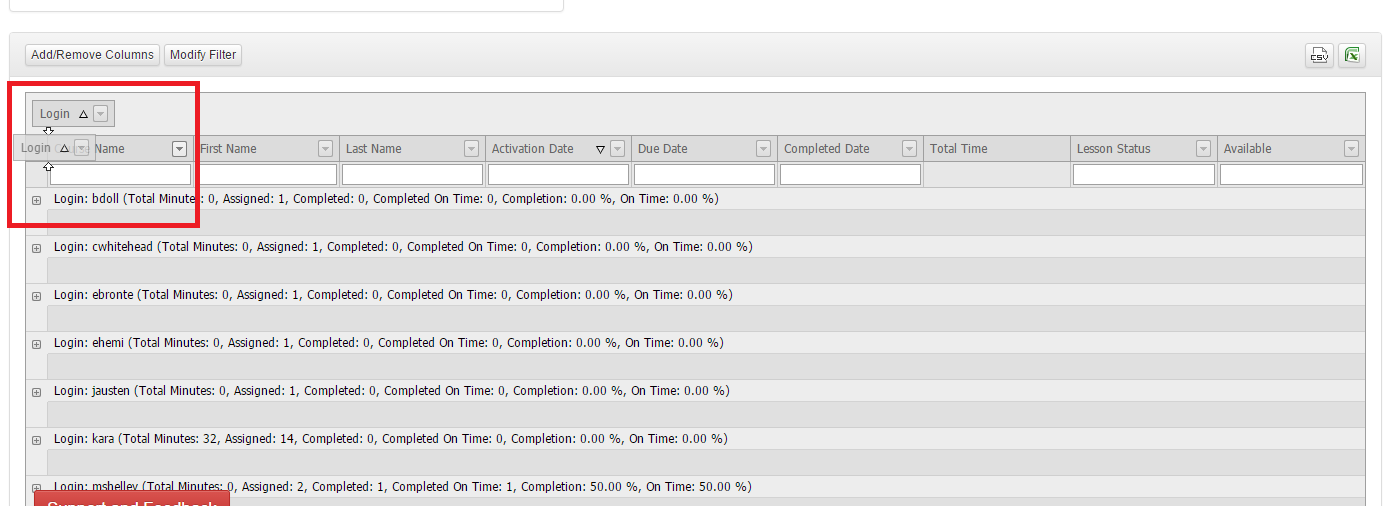
The filter box will then not have any filter applied.
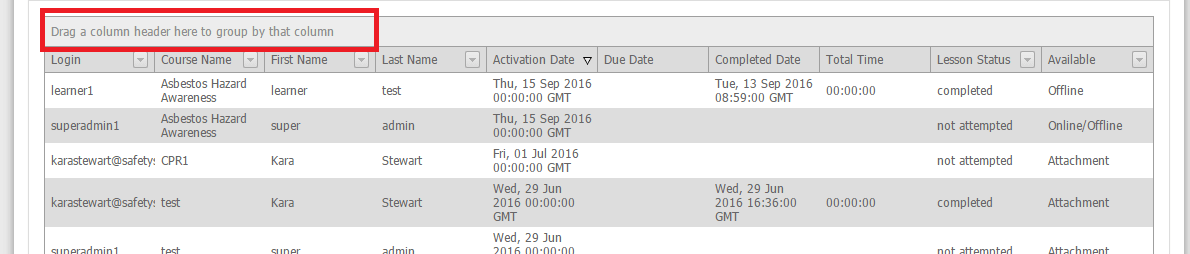
To apply a different filter for the box, simply click and hold over which column header(s) you would like to filter by, and drag those into the box above. You can filter with multiple column headers.
For instance, if you pulled in both “Login” and “Course Name,” the table would filter the data first by login, and then by course name.
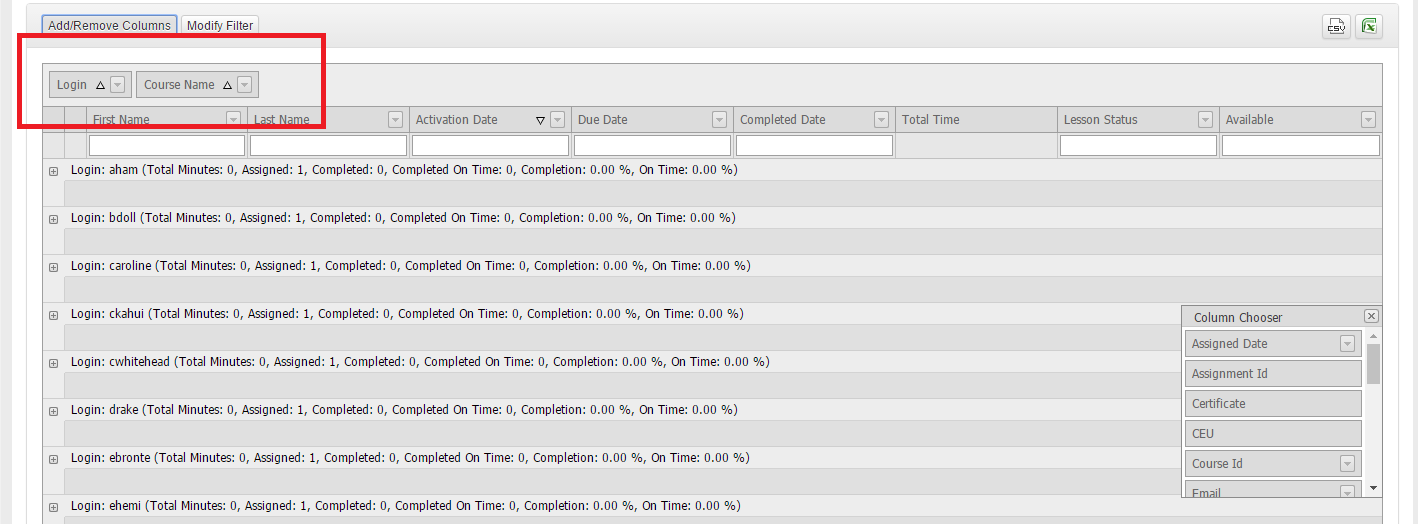
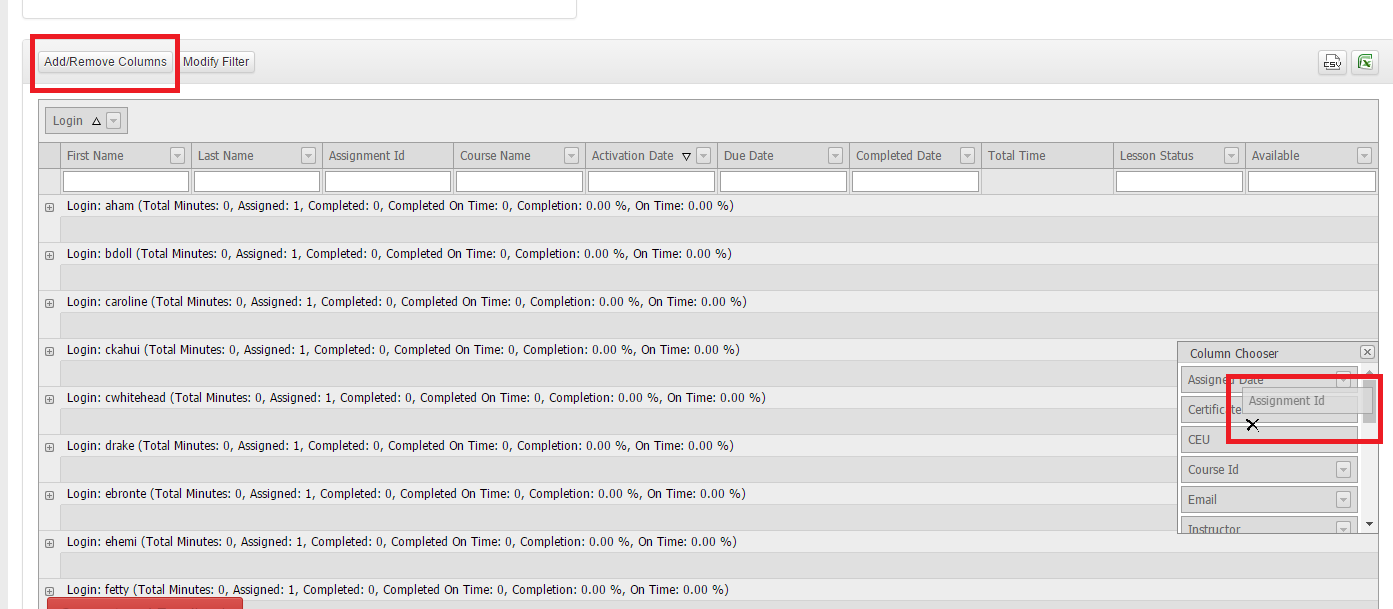
To pull in additional column headers, click the “Add/Remove Columns” button on the top left of the table. Drag a column header into the table until two white arrows appear to pull a new column into the table.
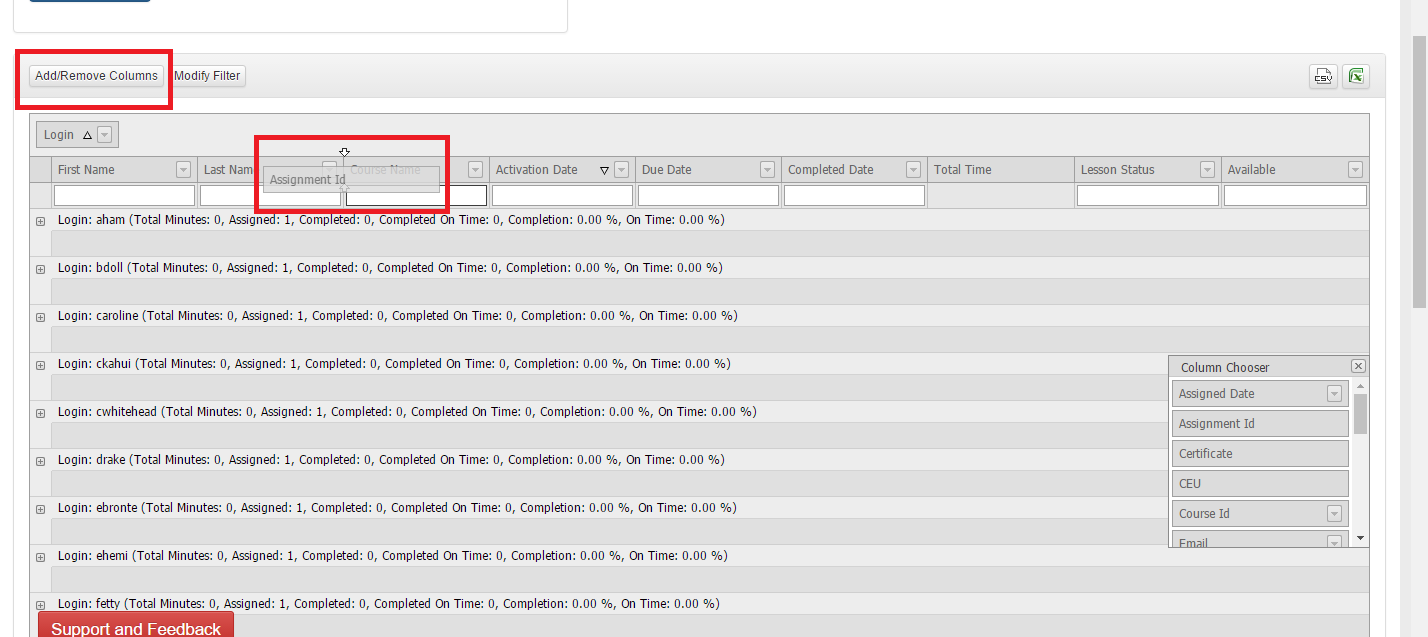
To remove a column header from the report, you will drag the column header to the “Column Chooser” pop-up. When a black “X” appears, you can drop the header and it will be removed from the table.
Once you have the data you need, you can choose to save the report using the drop-down filter at the top, or export into Excel at the top-right of the table. Please note: When exporting into Excel, the compliance percentage will appear as a decimal point. To convert this into a percentage, multiple the decimal point by 100.
You may also save this report to make it easier to access in the future. To do so, click the blue “Save As” button below the “Report Options” drop-down.
This will generate a pop-up allowing you to name the report.
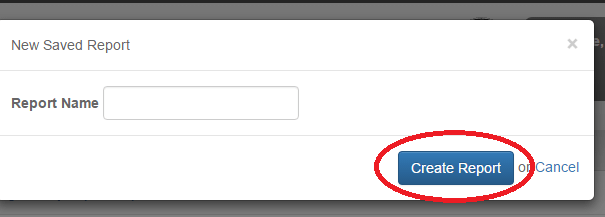
Once you have named your report and clicked to “Create Report,” the right side of the screen, under “Report Options,” will populate information regarding the report you are creating. A green pop-up will also appear in the right corner stating that your saved report has been created.
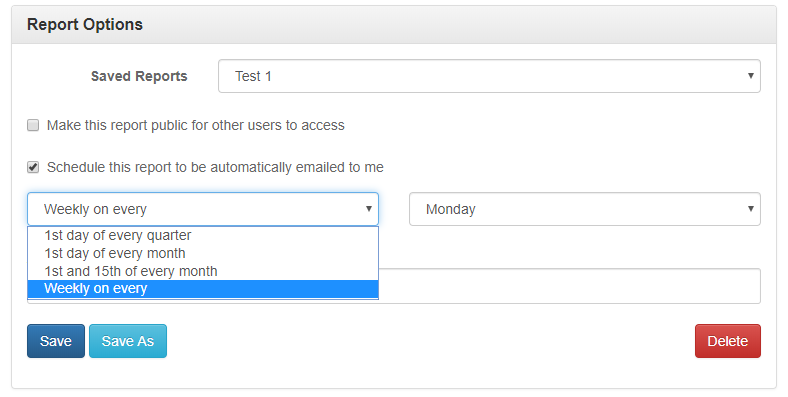
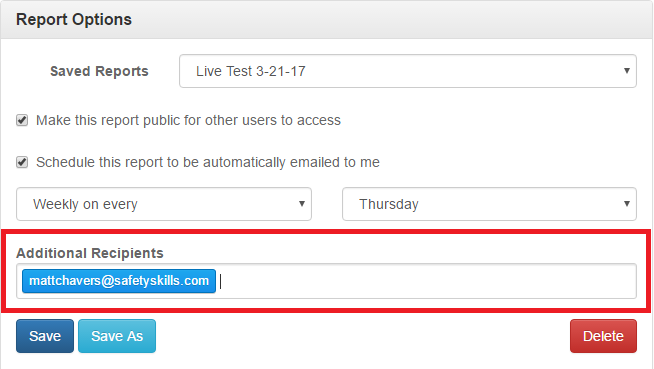
You now have the option to make the report public so that other users can access it, and to schedule the report to be automatically emailed to you. If you don’t need either of those options, simply click the “Save” button.
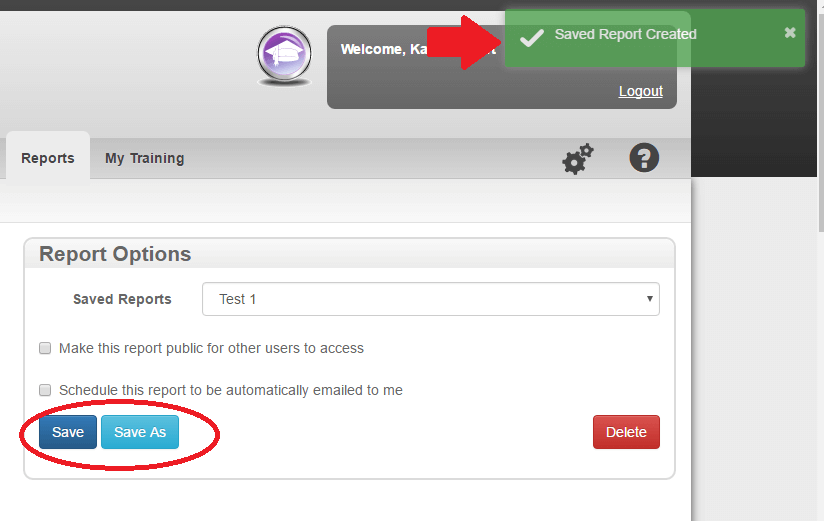
If you choose to make it a public report, it will populate in the “Saved Reports” drop-down of the initial Reports screen. Any Super Administrators and Administrators with rights to the group the report is for may also access this report.
If you choose to schedule the report to be emailed to you, a drop-down will appear where you can choose either the 1st of every month, the 1st and 15th of every month, or weekly by day. If you choose weekly by day, a second drop-down will appear allowing you to select the weekday.
An additional option will also appear, allowing you to send the report to additional users. These users do not need to be in the LMS account. To do this, simply enter the email address(es) you would like to have the report sent to, and click the blue “Save” button.
Please note that this article is for the “Compliance” option on the “Report Options” drop-down of the Reports tab, and not the “Compliance” report link at the top of the “Reports” tab. For more information on creating and managing reports, including the differences between the two compliance reports, please click here.