Reports Overview
If you have access to the report feature, you are able to create, run and view reports to see how your learners are doing with their training. For more information about user types and permissions please review these two articles: Creating User Types and User Permissions
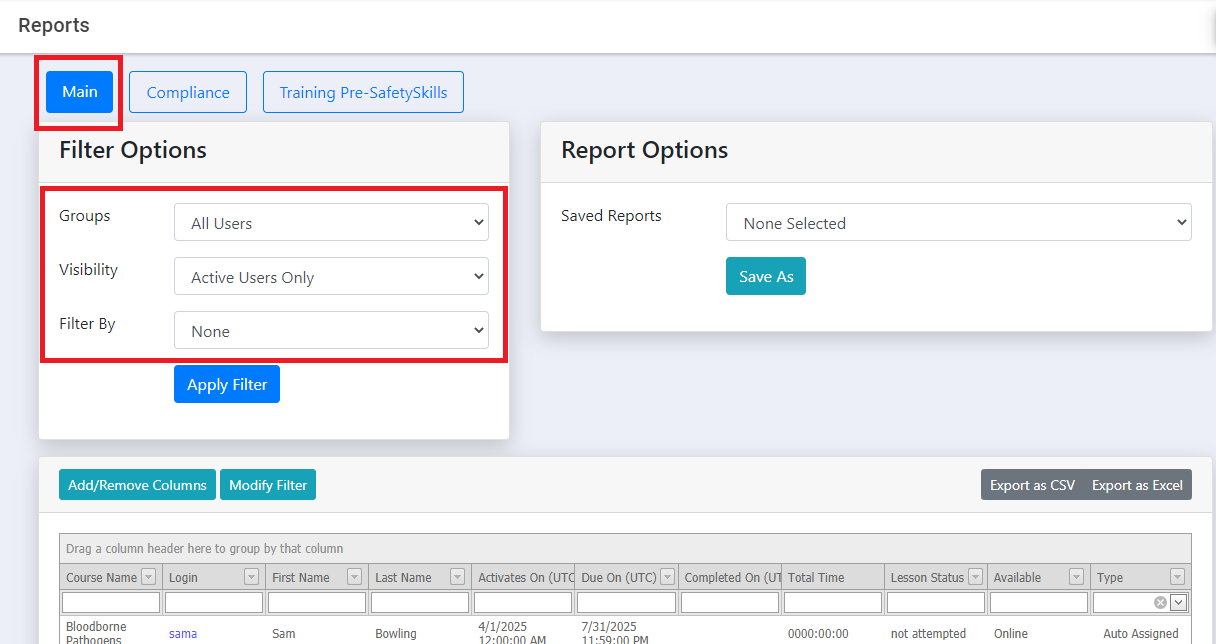
From the “Learning Management” section of the menu click on the “Reports” option. From here, you have quite a few options, you can choose a specific report area, create your own report, choose a report that has been created by another, or filter the assignment data in the table below and export it to excel.
The Main Report
The Main Report will display all applicable training history for your users. You can filter this view by groups, the users activation status by changing the “Visibility” settings, and/or a date range in the “Filter by” settings.
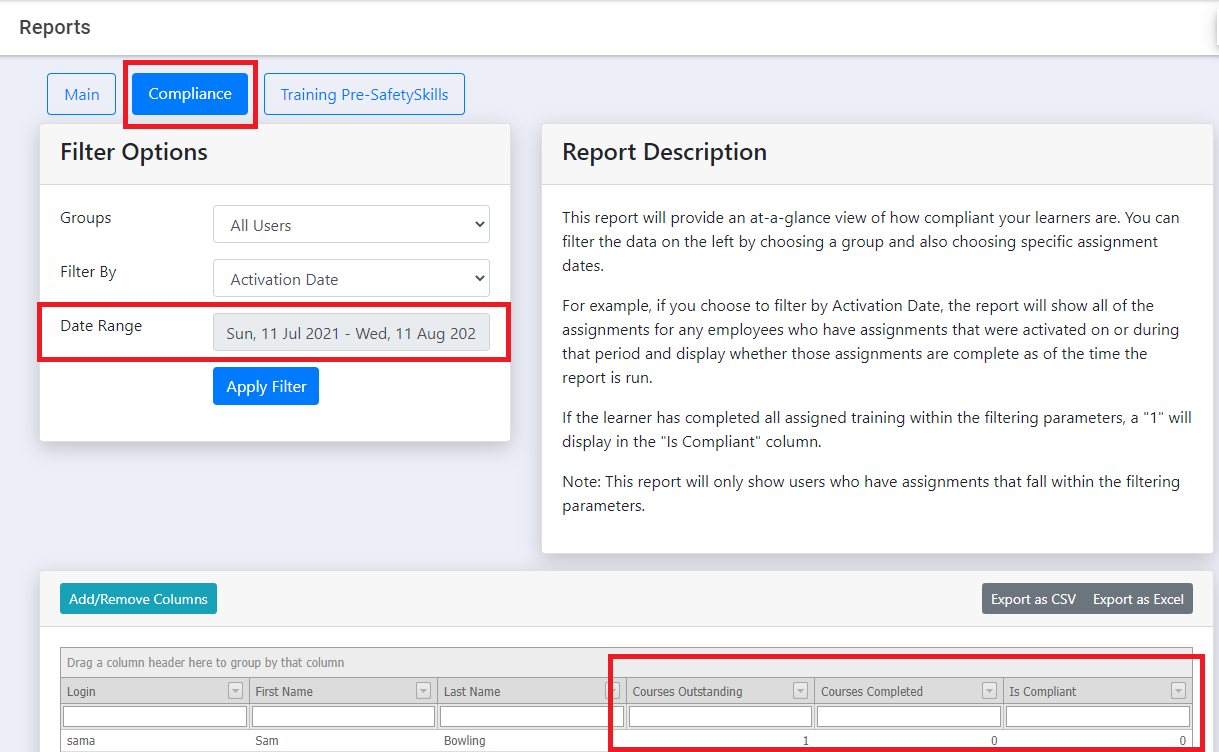
The Compliance Report
The Compliance Report will open a new window, which will display the percentage of users that are in compliance for the date range. Filtering by “Activation Date” will show all of the assignments for any learners who have assignments that were activated within the date range selected, whereas filtering by “Due Date” will show all of the assignments for any learners who had assignments due in the date range selected. Please note: This report will only display users who have assignments that fall within the filtering parameters. For a more detailed summary of your learners’ compliance, please view the article here.
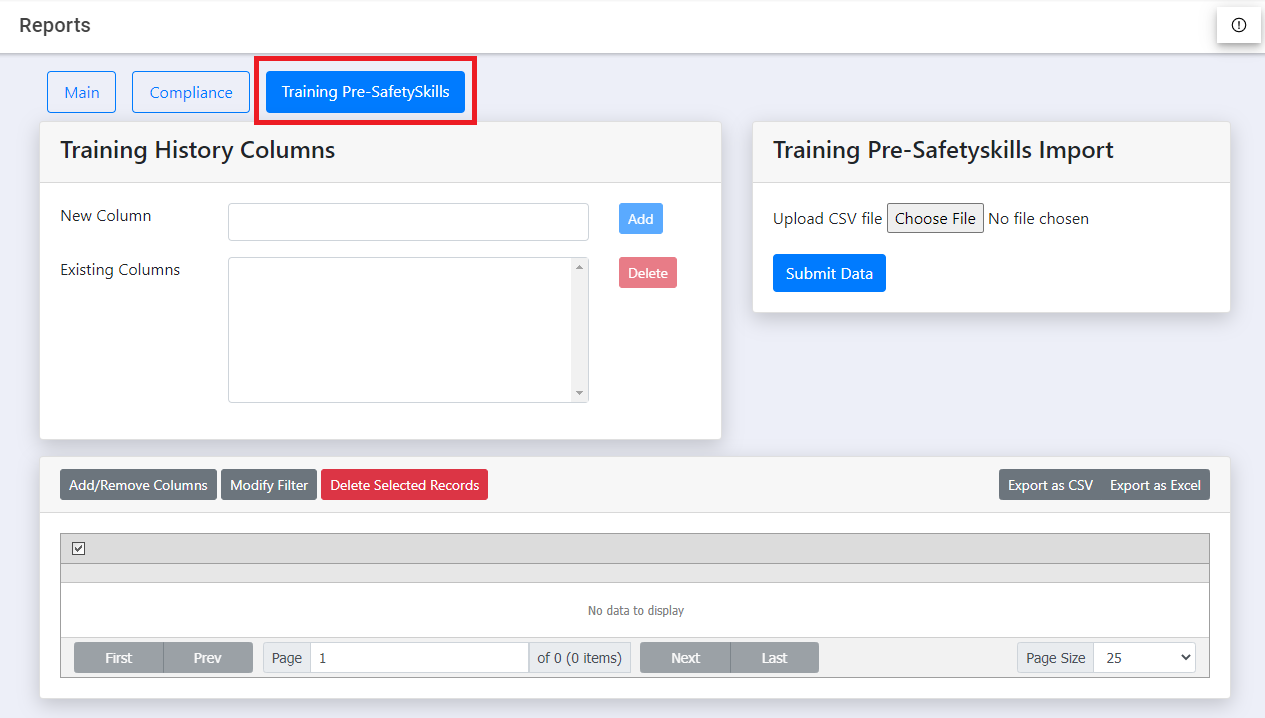
“Training Pre-SafetySkills” Report
The Training History Import/Report will allow you to import and run reports on training records that were completed on a different LMS. Please note: this feature is intended for temporary storage only and will not integrate into the SafetySkills user profile and/or history. Because this feature was developed as a temporary file repository, SafetySkills does not guarantee a back-up of this data.
This report area will be fully customized for your account. The “Owner” will be the only user types with access to editing this page.
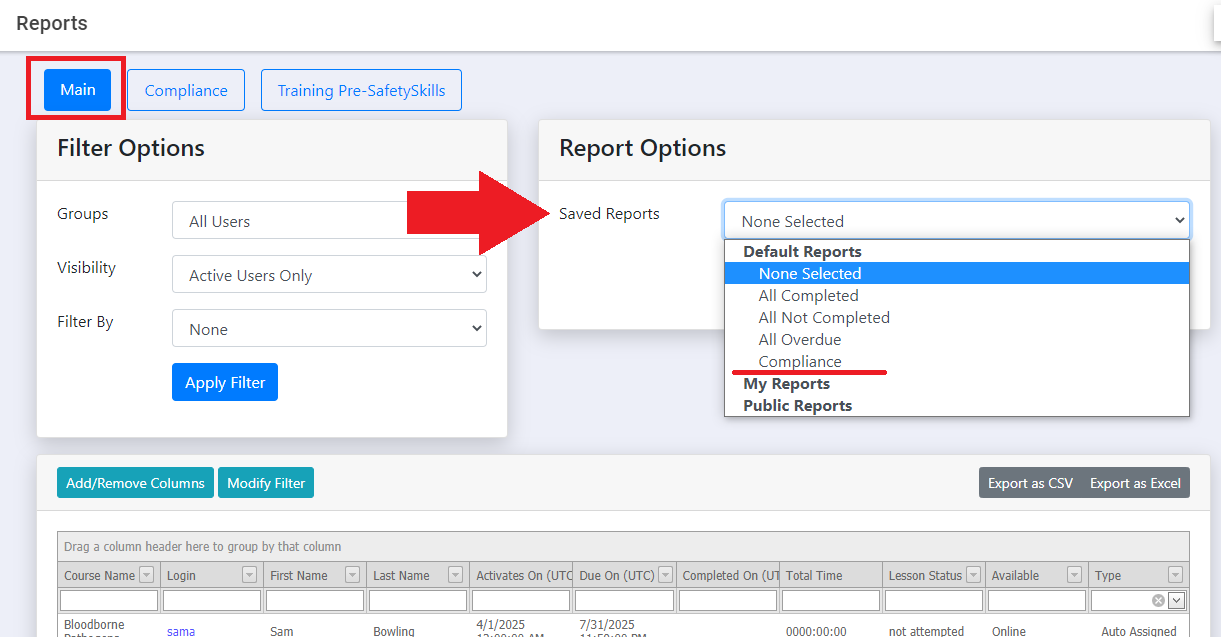
If those options don’t cover the parameters you are looking for, you can also access one of our saved reports on the Main reports page. The “Saved Reports” are either one of the popular reports preset by SafetySkills or it could be a report set-up and saved as a public report by another administrator in your account.
To access saved reports, click the drop-down box next to “Saved Reports.” This will provide a list of Default Reports, which includes All Completed, All Not Completed, All Overdue, and Compliance; Public Reports, which are any reports another administrator may have created and saved for public use; and any reports that you have created and saved.
Please note, that the Compliance report listed here is a more detailed version of the compliance report linked at the top. For more information about this detailed summarized report, please review the article: How to Run a Summarized Compliance Report
Create Your Own Report
To create and save your own report, start with the “Filter Options” box in the left-hand side of the main reports screen. The first drop down allows you to choose between all users, or users in a specific group.
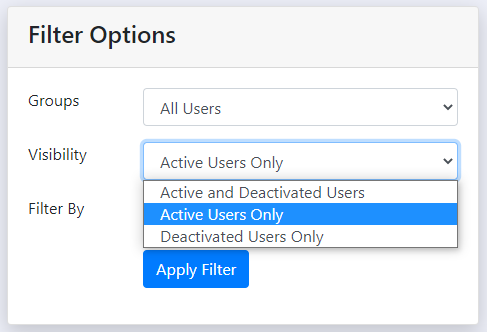
The “Visibility” drop down allows you to select either active users only, deactivated users only, or both activated and deactivated users.
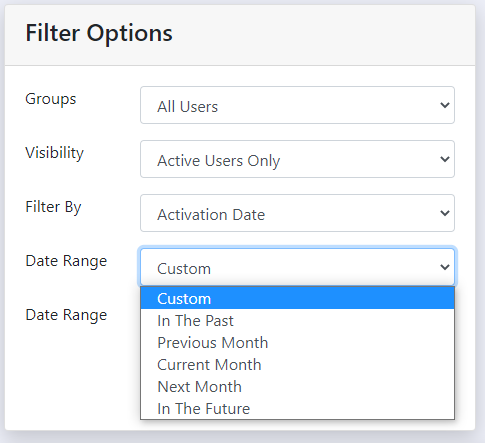
The third drop-down, “Filter By,” gives you several options on how to filter the report dates. First you will select between Activation Date (the date the assignment was accessible by the user), Assigned Date (the date the assignment was created), Completed Date (the date that the assignment was completed), or Due Date (the date that the assignment was due by). Then the options are to select a custom or dynamic date range to filter by. The preset dynamic date ranges are In The Past, Previous Month, Current Month, Next Month, or In The Future.
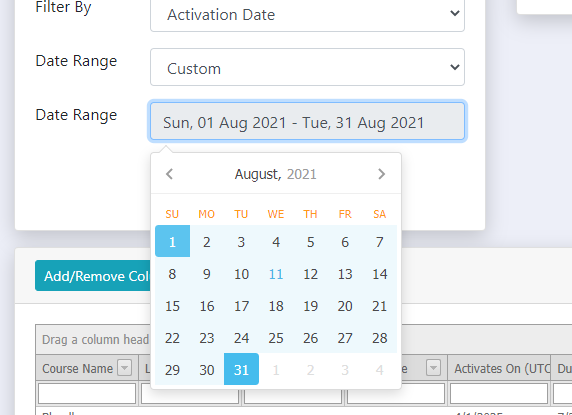
If you choose the custom option to filter by, you will need to also input the date range you wish to view. Click in the second Date Range field to select dates from a calendar.
To choose your date range, you will first select the beginning date you wish the system to look at, and then select the ending date. For example, if you would like to view assignments from March 1, 2021 to March 31, 2021, you would use the calendar arrows to go to March and select March 1 before you would select March 31. Please note, if you select a custom date range the report will always be set to those dates until the report is edited to have different dates.
Once you have selected the parameters you wish, you can click “Apply Changes” to run the report. Please note that is you are using the “Add/Remove Columns” to configure your view you will want to apply the filter options and then add or remove columns. If you click the “Apply Changes” button after modifying the columns, the preset columns will re-populate.
Save Your Report
If you want to save this report to make it easier to access in the future, you can click the blue “Save As” button on the right side of the screen. This is going to create a pop-up that will prompt you to type in the name of the report.
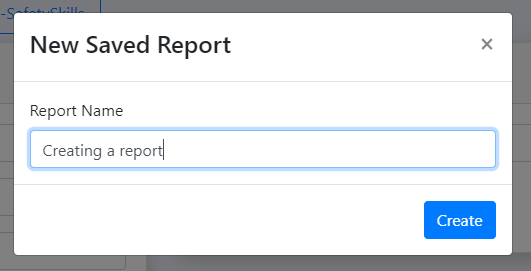
Once you have named your report and clicked “Create,” the report will be listed on the right side of the screen, under “Report Options.”
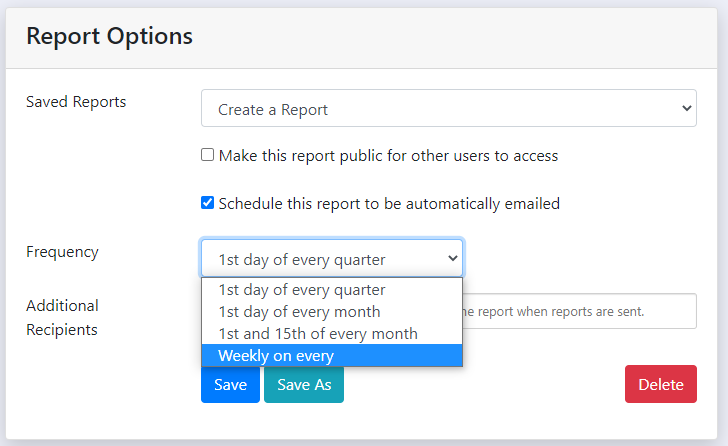
You now have the option to make the report public so that other users can access it, and to schedule the report to be automatically emailed.
If you choose to schedule the report to be emailed to you, a drop-down will appear where you can choose either the 1st day of every quarter, 1st of every month, the 1st and 15th of every month, or weekly by day. If you choose weekly by day, a second drop-down will appear allowing you to select the weekday.
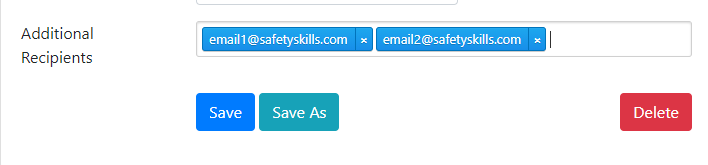
An additional option will also appear, allowing you to send the report to additional recipients. These users do not need to be in the account. To do this, simply enter the email address(es) you would like to have the report sent to in the space provided. You will need to enter each email and hit “Enter” to add the email, repeat this for each email you would like to add. There is a limit of 25 additional emails per report. Please note, you must have an email listed in your profile to send reports to other email addresses.
Once you have made your selections, be sure to click the blue “Save” button to save any changes made to your report.
Delete a Report
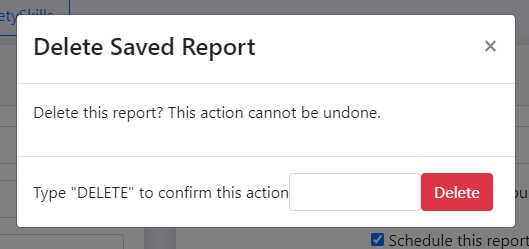
If you want to delete a report, you can do that by selecting the report from the drop-down and clicking the red “Delete” button. This will launch a pop-up that will have you confirm deletion by typing “Delete” and clicking “Delete Report”.
Customizing the columns
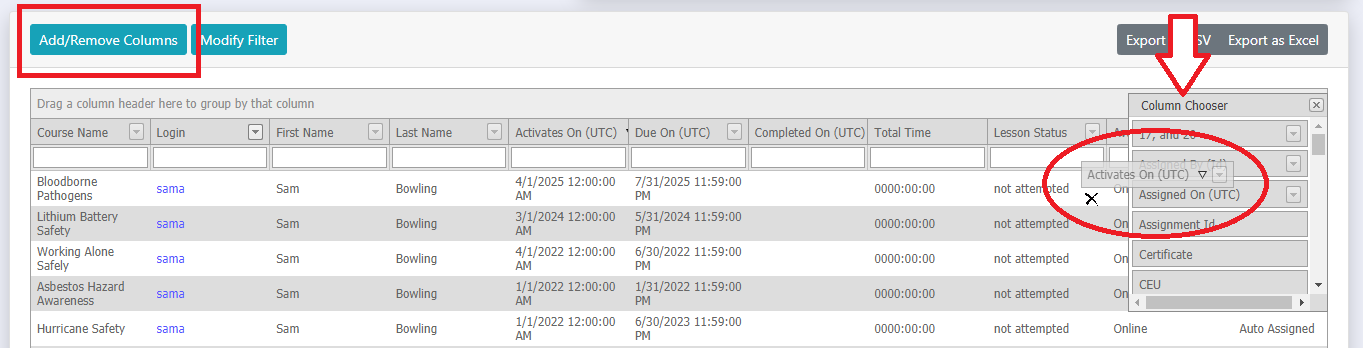
Also, you can choose what information is available in the table on the reports screen. To do this, click on the “Add/Remove Columns” button at the top left of the table. This will bring in a pop-up with several column options, including “Assigned Date” and “Last Accessed On.” Bring in a new column by dragging the new column into the column header line (two arrows will appear).
To remove columns, drag and drop the column header into the “Add/Remove Columns” box. A black “X” will appear, allowing you to release the column header and remove it from the table.
Sorting the columns
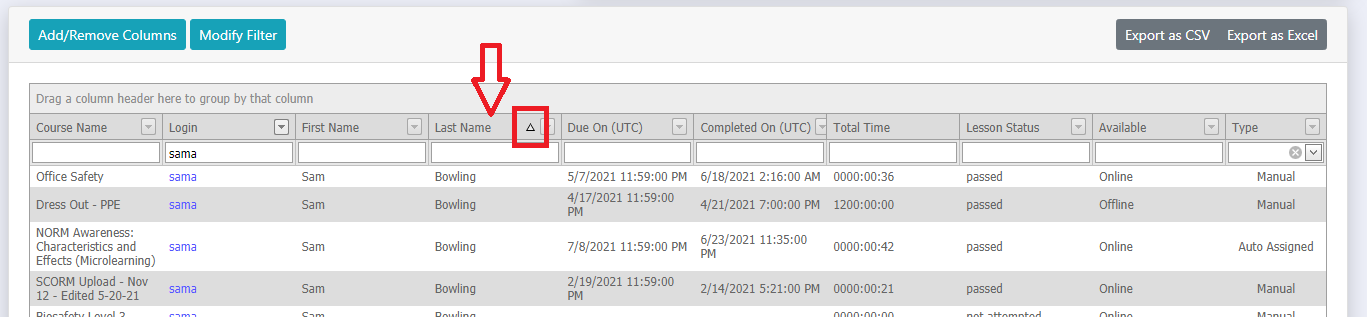
To sort the data within the columns you can click in the gray area of the column header. This will allow you to sort the report by that column. For example, if you click once in the header area for “Last Name” this will sort that column from A-Z. When this is done a small arrow pointing up will appear to illustrate that the column is being sorted.
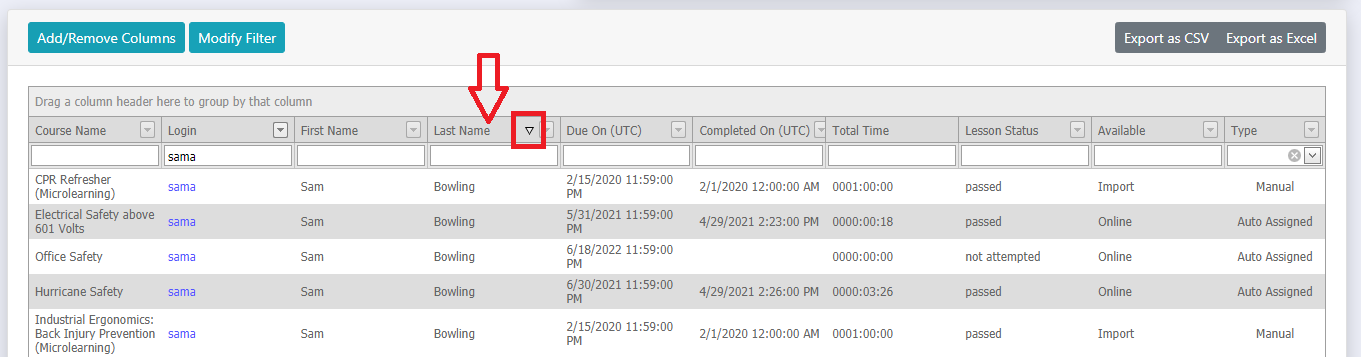
If you click twice in the column header instead of once, it will reverse this and sort from Z-A. When this is done a small arrow pointing down will appear. These actions can also be done on date columns and numerical columns.
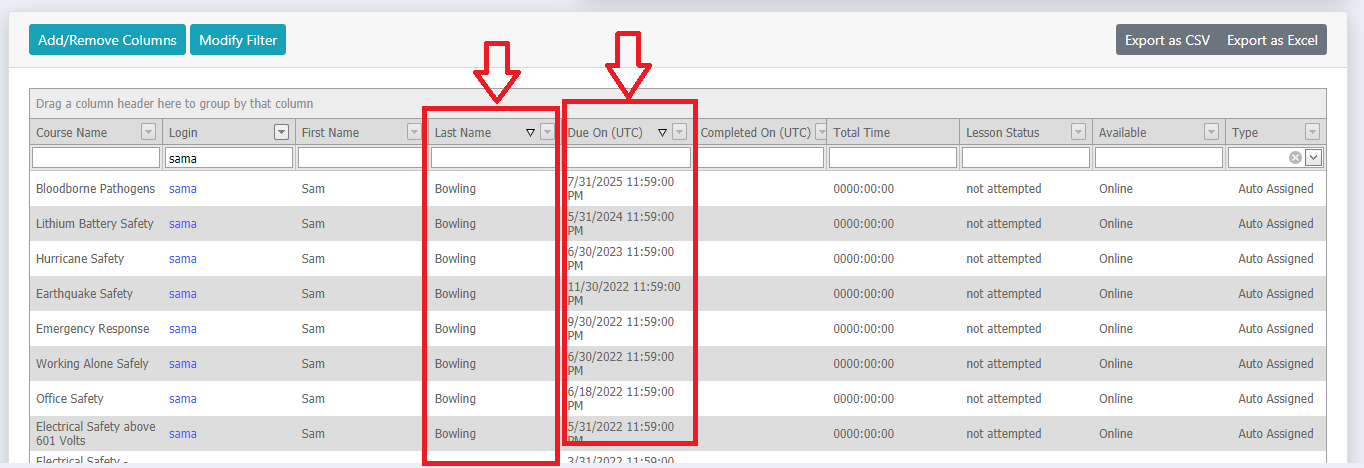
The Reporting feature will allow you to sort by two columns at once. To complete this you will sort by your first column by clicking in the column header. Next hold down “Shift” on your keyboard and click on the second column you would like to sort by.
Export Report Data
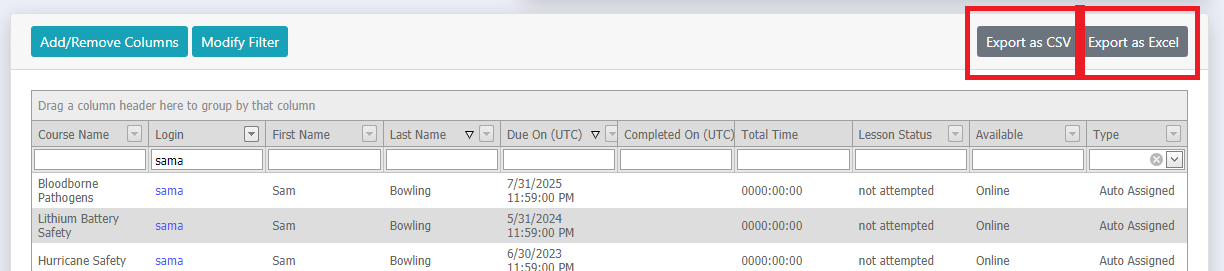
You can also export the data table to Excel using the icons at the top right of the table. However, this will populate the Excel file in the exact way the data is shown in the table, which may require some editing if you need to distribute the report in a specific way.
Please note: any additional columns you bring in to the table view will not be saved UNLESS you save the report. Each time you access the Reports tab, the table view will be refreshed and revert back to the original column fields.
If you have any questions about the Reports feature please contact the SafetySkills Help Desk at support@safetyskills.com or call 405-463-6656, option 2. The SafetySkills Help Desk is available Monday through Friday, from 7 AM to 6 PM Central time.