Depending on your User Type’s permissions will determine if you have access to the Reports feature. For more information about User Types and permissions please review these two articles: Creating User Types for SafetySkills Engage and SafetySkills Empower and User Permissions for SafetySkills Engage
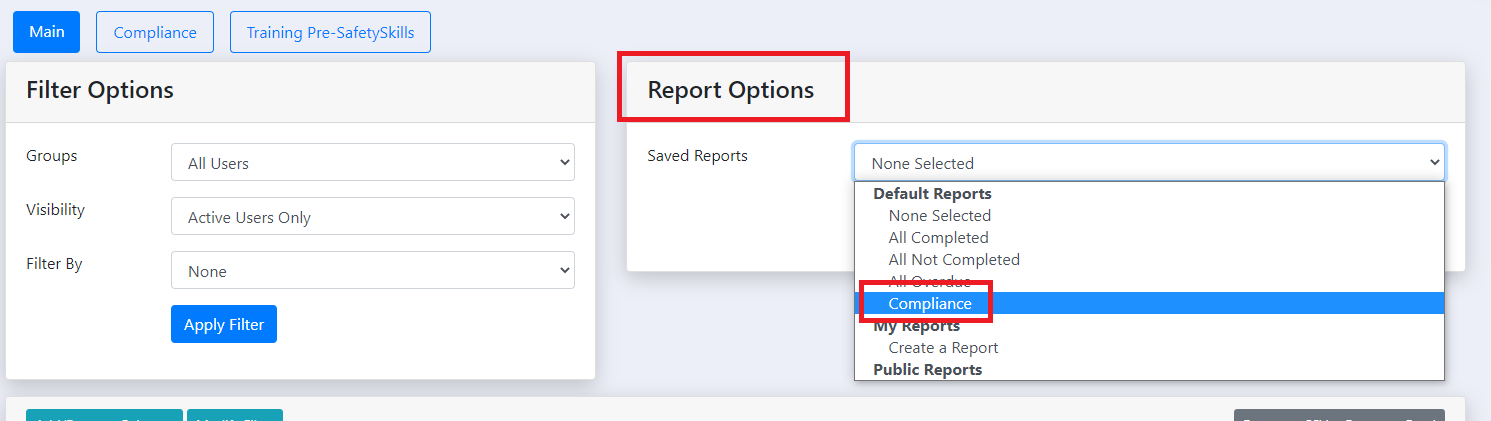
Begin by going to the Learning Management section of the menu, then click on the “Reports” option. From the Reports page, you can now run a summarized report that will detail the time spent in training, compliance percentage, and outstanding training. To run this report, use the “Report Options” drop-down on the right, and select “Compliance.”
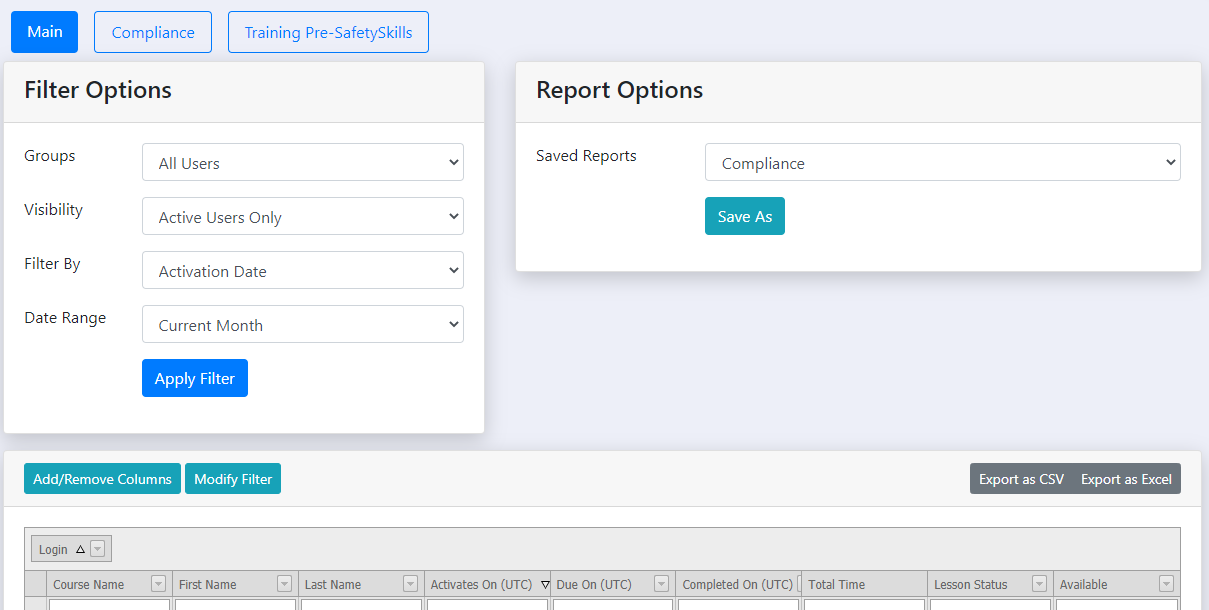
The default settings for the report will be for all users and assignments that activated in the current month.
From there, you can use the drop-down options on the left to choose the data you wish to pull into the report.
- The initial drop-down will allow you to choose one group or all users.
- The “Visibility” drop-down allows you to choose from active users, deactivated users, or both active and deactivated users.
- The “Filter By” drop-down allows you to choose from activation date, due date, assigned date, completed date, or none.
- Depending on the “Filter By” option you chose, you may then select a specific date range.
For example, if you want to filter by the date a course was activated, you can then choose any activation date that occurred “In the Past,” “Previous Month,” “Current Month,” “Next Month,” “In the Future,” or choose “Custom Range” to select a custom date range. Then, click the blue “Apply Filter” button to have the data populate in the table.
The data in the table will automatically group by “Login.” This shows you a summary, by login, of the user’s compliance percentage, the total minutes spent on training, and the number of courses they have been assigned and have completed for the range selected.
To see a detailed list of the courses for each learner, click the “+” next to their login.
You can alter the way the table data is grouped by dragging the column headers to and from the header area at the top of the table.
For example, to remove the “Login” grouping, you will click and hold your mouse on the “Login” box, and drag it back to the column headers area. When you see two white arrows, you can release your mouse. This will then remove the grouping/grouped by settings.
To apply a different grouping, simply click and hold the column header, or custom field, you would like to group by, and drag it to the header area above the columns. You can group by multiple column headers if you would like.
For instance, if you pulled in both “Course Name” and “Login,” the table would group the data first by course name, and then by login.
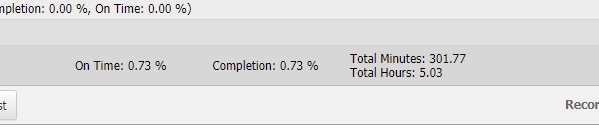
The totals for the minutes spent on training and the total compliance percentage for the entire data set is presented at the bottom of the table.
Once you have the data you need, you can export into Excel at the top-right of the table. Please note: When exporting into Excel, the compliance percentage will appear as a decimal point. To convert this into a percentage, multiple the decimal point by 100.
You may also save this report to make it easier to access in the future. To do so, please review the sections about saving a report located in this article: How To Create and Run Reports
Please note that this article is for the “Compliance” report option listed in the “Report Options” drop-down of the Reports page. This is not the same report as the “Compliance” report link at the top of the “Reports” page.